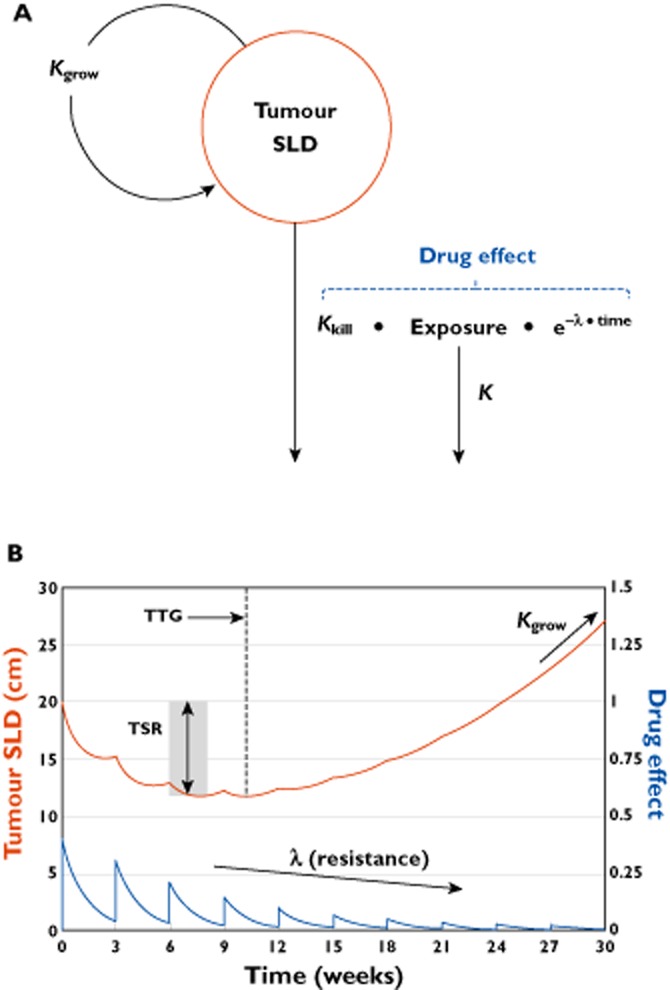
Figure 2.

TGI model structure and representative plot. (A) Compartmental representation of the TGI model. Kgrow: tumour growth rate constant; Exposure: drug exposure metric; K: drug exposure elimination rate constant; Kkill: tumour kill rate constant; λ: drug resistance parameter. Kgrow, Kkill, and λ are model parameters to be estimated. K describes drug elimination in cases where the PKPD driver is dynamic and may be estimated or fixed based on the drug elimination half-life; the K parameter was not in the original publication [23] (i.e. K = 0), but can be applied to characterize reduction in exposure. (B) TGI model-predicted tumour SLD (red curve) and drug effect (blue curve) time courses for a once every 3 week (q3w) drug treatment. TSR: tumour size ratio from baseline, typically assessed after 1 or 2 treatment cycles (6–8 weeks); TTG: time to tumour growth. TSR, TTG, Kgrow, and tumour SLD time course are metrics that can be assessed as predictors for survival
