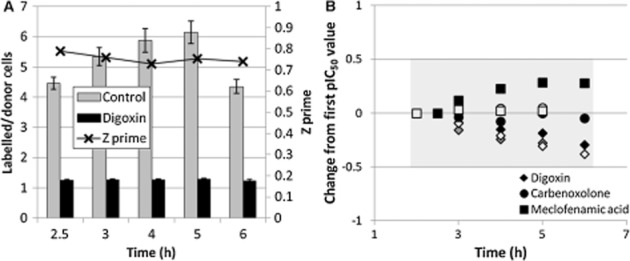
Figure 2.

Effect of dye transfer time on signal-noise and IC50 value. (A) Representative result of five separate experiments showing time course of dye transfer under control and maximally inhibited (10 μM digoxin) conditions. Separation between minimum and maximum signals was quantified using the Z' factor statistic. (B) Effect of dye transfer time on calculated pIC50 values for Cx43 uncouplers digoxin, carbenoxolone and meclofenamic acid, shown as pIC50 change from first pIC50 value. Shaded area represents a <0.5 log unit change from initial value. Black, grey and white shading represent determinations in separate experiments (n = 3).
