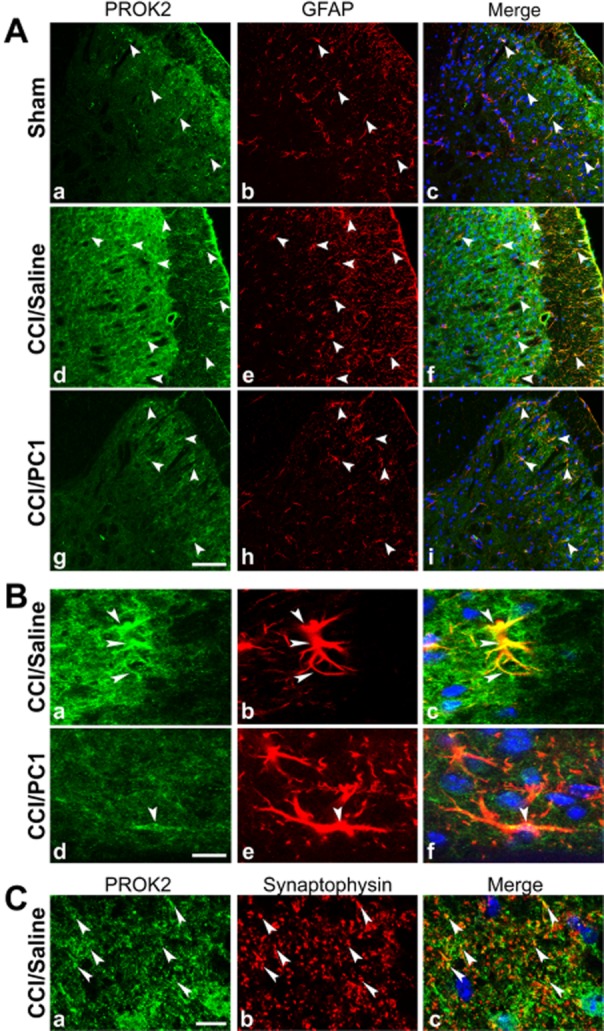
Figure 7.

Representative images showing PROK2 localization in the mouse L4–L5 spinal cord dorsal horn. (A) PROK2-positive profiles (green) in sham (a), CCI/saline (d) and CCI/PC1 (g) mice. GFAP (astrocyte marker) positive profiles (red) in sham (b), CCI/saline (e) and CCI/PC1 (h) mice. Sciatic nerve ligation induced a substantial increase in PROK2 and in GFAP signal 10 days after ligation. Double staining reveals a colocalization of PROK2 with the astrocyte marker GFAP (f). Scale bar: 50 µm. (B) High-magnification image (scale bar: 10 µm): double immunofluorescence labelling for PROK2 (green) and GFAP (red) shown in single channels (a, d and b, e) and as a merged image (c, f) showing that activated astrocytes (GFAP-positive enlarged cell bodies and thick processes) contain PROK2 (yellow, c). PC1 treatment (150 µg kg−1 s.c. twice a day for 7 days) reduced PROK2 immunofluorescence in the astrocytes (f). (C) Representative images showing colocalization (c) of PROK2 (green, a) with synaptophysin (red, b). Scale bar: 10 µm. Cell nuclei were counterstained with DAPI (blue).
