Figure 3.

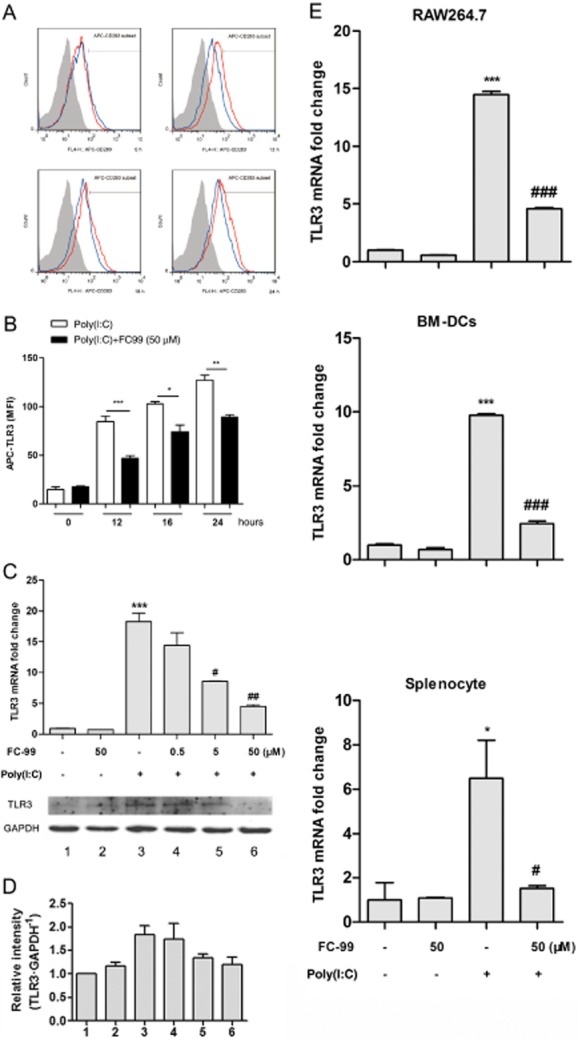
FC-99 suppressed TLR3 expression induced by poly(I:C) in vitro. (A) Peritoneal macrophages were pretreated with FC-99 for 2 h and exposed to 25 μg·mL−1 poly(I:C) for the indicated time periods. TLR3 expression was measured by flow cytometry. Shaded grey, isotype control; red line, treated with poly(I:C); blue line, treated with FC-99 and poly(I:C). In (B), the MFI calculated from the histogram. n = 5 in each condition. *P < 0.05, **P < 0.01, ***P < 0.001. (C) Peritoneal macrophages were pretreated with FC-99 for 2 h and exposed to 25 μg·mL−1 poly(I:C) for another 6 h (up, mRNA level) or 24 h (down, protein level) and TLR3 expression in different levels were measured by Q-PCR (n = 4) or Western blot. (D) Histogram shows the relative band intensity of Western blot from three independent experiments. (E) RAW264.7, BM-DCs and splenocytes were pretreated with FC-99 for 2 h and exposed to 25 μg·mL−1 poly(I:C) for another 6 h. TLR3 mRNA levels were measured by Q-PCR (n = 4). Data are means ± SEM. *P < 0.05, ***P < 0.001 versus control; #P < 0.05, ##P < 0.01, ###P < 0.001 versus poly(I:C) treated alone.
