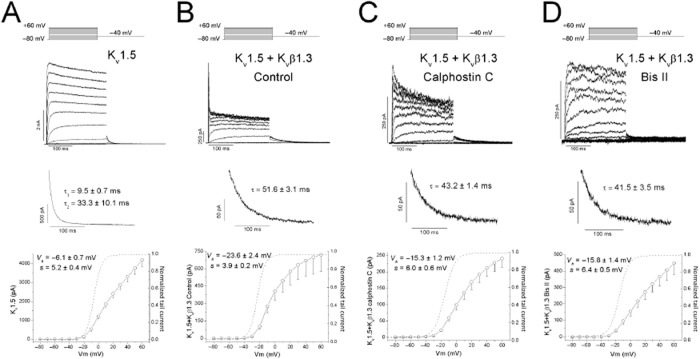
Figure 1.
Original recordings obtained upon depolarization from a holding potential of −80 to +60 mV in 10 mV steps and upon repolarization to −40 mV. (A) Current recordings obtained from the activation of Kv1.5 channels. (B) Current recordings of Kv1.5 channels in the presence of the Kvβ1.3 subunit. (C) Current recordings of Kv1.5 channels in the presence of a Kvβ1.3 subunit in cells that had been previously treated with calphostin C. (D) Current recordings of Kv1.5 channels in the presence of a Kvβ1.3 subunit in cells that had been previously treated with bisindolylmaleimide II. In all cases, the current (top), the deactivation process recorded at −40 mV after a pulse to +60 mV (middle) and the I–V relationship and activation curves (dashed line) obtained (bottom) are shown. When PKC is inhibited, the linearity of the I–V is recovered, and the activation process is shifted towards a more negative potential when the Kvβ1.3 subunit is present.

