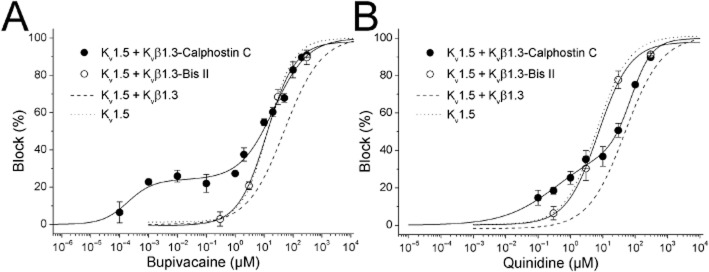
Figure 4.

Concentration-dependence of bupivacaine-induced (A) and quinine-induced (B) blockade of calphostin C- or bisindolylmaleimide II-treated Kv1.5 + Kvβ1.3 channels. The dotted and dashed lines represent the dose–response curves obtained for the bupivacaine- and quinidine-produced blockade of Kv1.5 channels alone and Kv1.5 + Kvβ1.3 channels, respectively (taken from González et al., 2002). The reduction in the current (relative to the control) at the end of depolarizing steps from −80 to +60 mV was used as an index of blockade. Concentration–response curves for bupivacaine and quinidine in calphostin C-treated Kv1.5 + Kvβ1.3 channels and in bisindolylmaleimide II-treated Kv1.5 + Kvβ1.3 channels are shown. Each point represents the mean ± SEM of three to eight experiments. The continuous line represents the fit of the experimental data to a biphasic or monophasic Hill equation.
