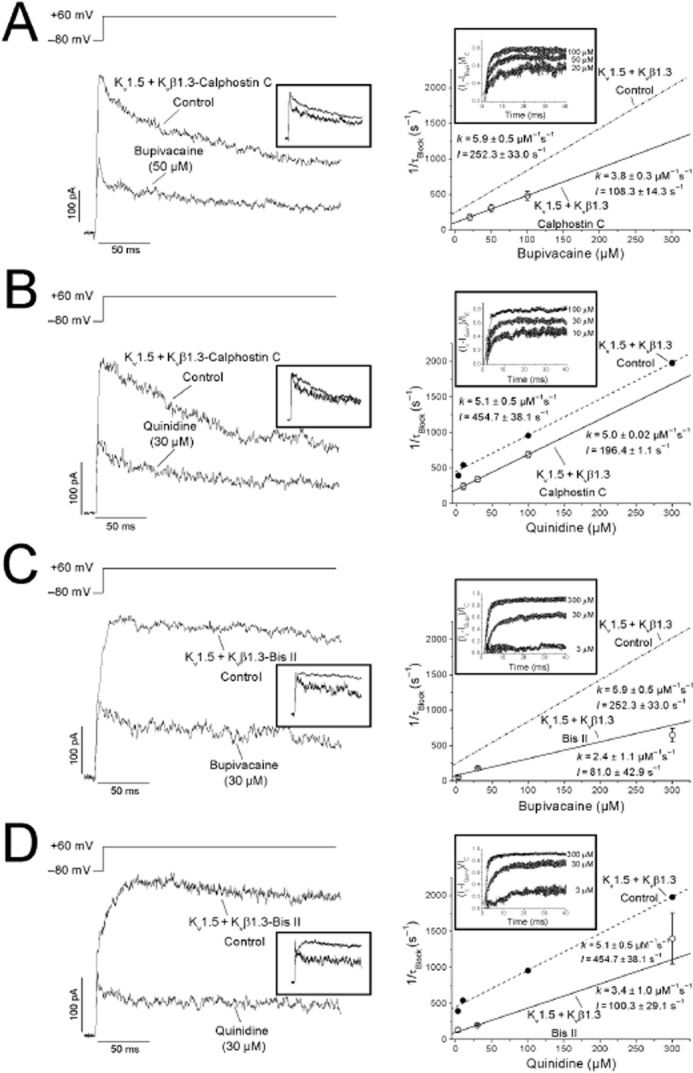
Figure 5.

Time-dependence of bupivacaine- and quinidine-induced blockade of calphostin C- and bisindolylmaleimide II-treated Kv1.5 + Kvβ1.3 channels. Left: Superimposed traces for the steps from −80 to +60 mV and those normalized to the control values (inset). Right: Relationship between 1/τB values at different concentrations of bupivacaine (A, C) and quinidine (B, D). Each point represents the mean ± SEM of three to six experiments. For a first-order blocking scheme, a relationship is expected: 1/τB = k × [Drug] + l. The lines represent the fit from which the apparent binding (k) and unbinding (l) rate constants were obtained under control (dashed) and PKC-inhibited (solid) conditions. The relationship between the sensitive current and depolarizing time [(Icontrol − Idrug)/Icontrol] at three different drug concentrations is plotted in the inset of each panel.
