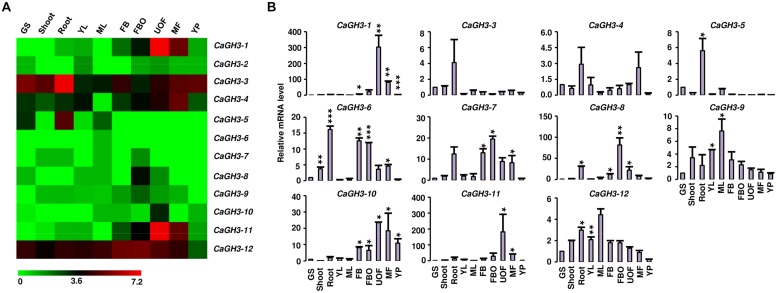
FIGURE 3.
Expression profiles of CaGH3 genes during development. (A) Heatmap showing expression profiles of CaGH3 genes based on RNA-seq data in various tissues/development stages. Heatmap was generated based on log2 FPKM. (B) Real-time PCR analysis of CaGH3 genes in various tissue/stages of development. Expression of germinating seedling (GS) was taken as a reference to determine relative mRNA level in other tissues for each gene. Error bars indicate SE of mean. YL, young leaf; ML, mature leaf; FB, flower bud; UOF, unopened flower; FBO, flower bud open; MF, mature flower; YP, young pod. Data points marked with asterisk (*P ≤ 0.05, **P ≤ 0.01, and ***P ≤ 0.001) indicate statistically significant difference between control (GS) and other tissues.

