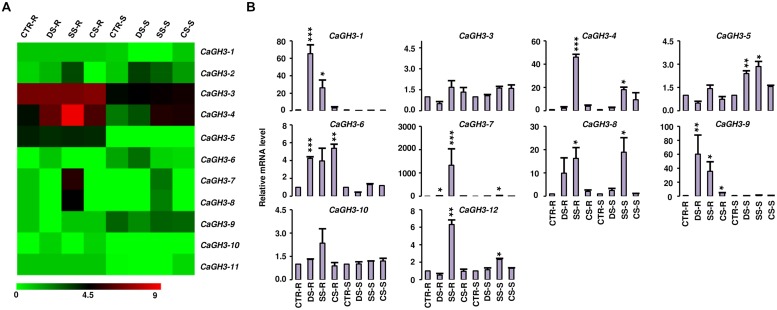
FIGURE 5.
Expression profiles of CaGH3 genes under abiotic stress conditions. (A) Heatmap showing expression of CaGH3 genes based on RNA-seq data. Heatmap was generated based on log2 FPKM. (B) Real-time PCR analysis of CaGH3 genes under various stress treatments. Root control (CTR-R) and shoot control (CTR-S) was taken as a reference to determine relative mRNA level under stress conditions. Error bars indicate standard error of mean. DS-R: desiccation stressed root, SS-R, salt stressed root; CS-R, cold stressed root; DS-S, desiccation stressed shoot; SS-S, salt stressed shoot; CS-S, cold stressed shoot. Data points marked with asterisk (*P ≤ 0.05, **P ≤ 0.01, and ***P ≤ 0.001) indicate statistically significant difference between control and stress treatments.

