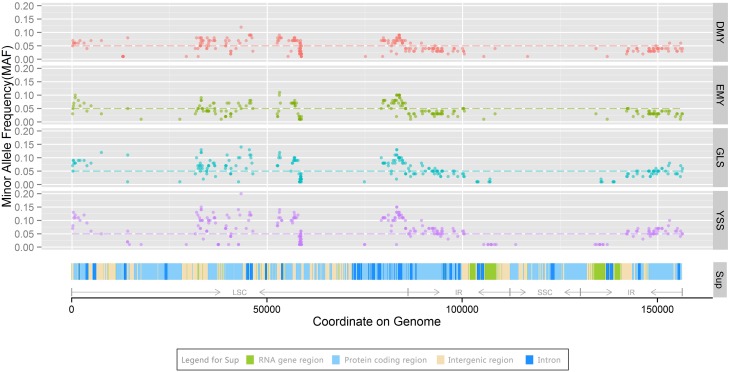
Figure 4.
Minor allele distribution among chloroplast genomes of four strains. In the panels DMY, EMY, GLS, and YSS, the dashed lines indicate a minor allele frequency (MAF) of 0.05. The panel Sup shows tRNA and rRNA genes, protein-coding, intergenic, and intron regions on the chloroplast genome, the colors are shown in the legend for Sup. LSC, SSC, and IR regions are marked using arrows.

