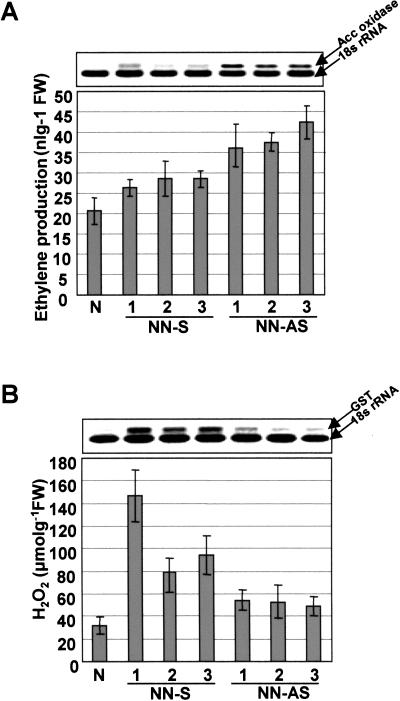
Figure 6.
Measurements of ethylene and H2O2 levels in planta in transgenic plants and control plants. A, Analysis of ACC oxidase transcripts using RT-PCR and measurement of ethylene level in planta through gas chromatography. B, Analysis of GST transcripts using RT-PCR and measurement of H2O2 level in planta. The mean number of five experiments was shown on the graph. Error bars indicate sds. 18S indicates 18S rRNA products.

