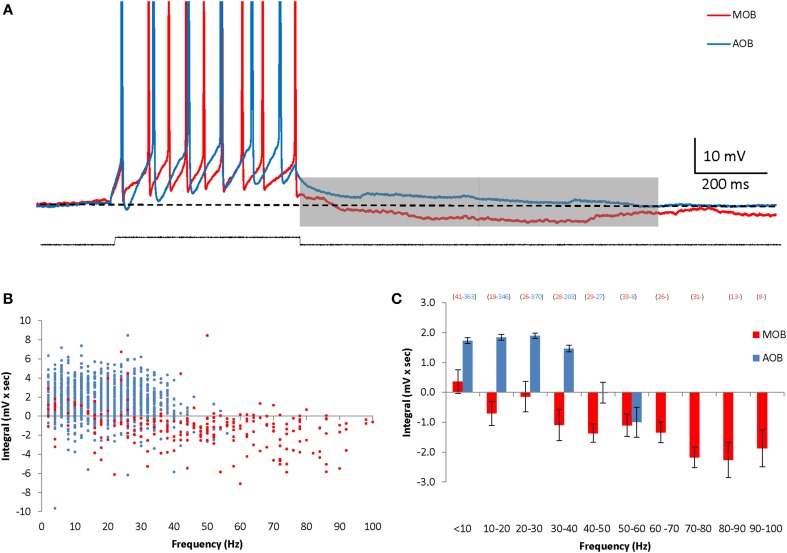
Figure 2.
AOB and MOB mitral cells exhibit opposite afterpotentials in response to depolarizing current injections. (A) Superimposed MOB (red) and AOB (blue) voltage responses to a 30 pA square-pulse depolarizing current injection. Spikes were cut at 0 mV. (B) The calculated DAP integral as a function of the firing frequency in 1317 stimuli given to 70 AOB cells, and 254 stimuli given to 14 MOB cells. (C) Mean (±s.e.m.) values of the data shown in (B), using 10 Hz bins.

