Figure 7.
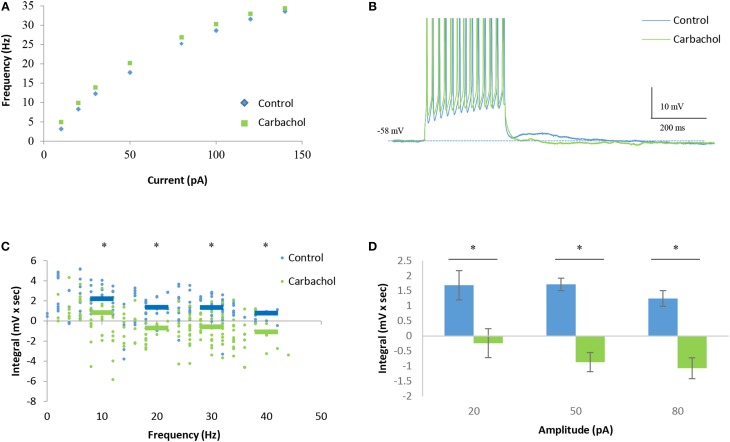
Carbachol blocks DAPs in AOB mitral cells. (A) Mean current-frequency (I-F) curves of the same cells as in Figure 6 before (blue) and after (green) carbachol (1 μM) application to the bath solution. (B) Representative voltage responses to 40 pA square-pulse stimulation of the same cell in control and carbachol conditions. Spikes were cut at 0 mV. (C) Mean (±s.e.m.) DAP integral of all responses of the same cells, plotted as a function of the firing frequencies. Horizontal lines represent the mean using 10 Hz bins. (D) Mean (±s.e.m.) values of the DAP integral of the responses to three current amplitudes representing low (20 pA), moderate (50 pA), and high (80 pA) stimulation levels. A significant difference (*p < 0.05, paired t-test corrected for multiple comparisons) was found between control and carbachol conditions for all stimulation levels.

