
Figure 1. Comparison of agonist radioligand (125I-Sar1 Ang II) and antagonist radioligand (125I-Sar1,Ile8 Ang II) binding to hypothalamic membranes from “desensitized” and “non-desensitized” rat brains.
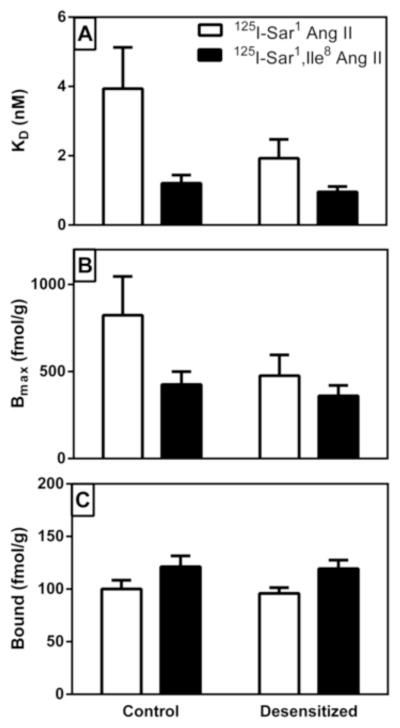
Panel A describes the average dissociation constant (KD) of the radioligands for binding to the hypothalamic membranes for the two different treatment groups. Panel B describes maximal binding (BMAX) of each of the radioligands to the two different groups. Panel C describes the derived values for radioligand binding at 500 pM concentration (to be representative of physiological levels of Ang II that the receptors might be exposed to) based on the average KD and Bmax values for each radioligand and treatment group. Values shown are mean ± S.E.M. n = 11.