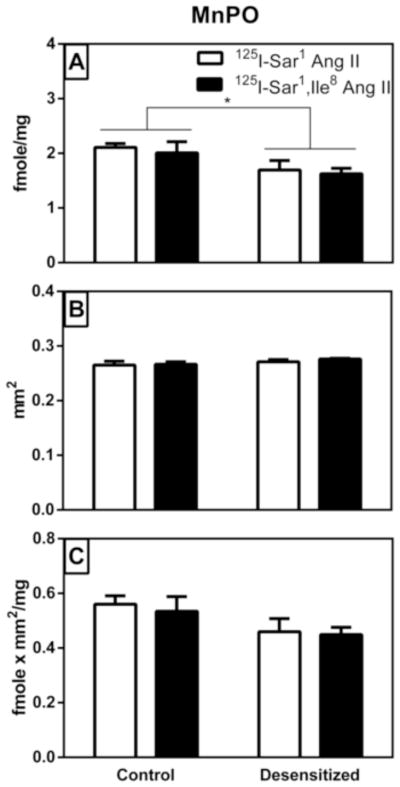
Figure 6. Graphical representation of specific AT1 receptor binding to the median preoptic nucleus (MnPO) of vehicle treated control and “desensitized” rat brains.

Panel A shows the density of binding within the circumscribed area defined as the MnPO. Panel B shows the area that was circumscribed as the MnPO where there was a high expression of AT1 receptor binding. Panel C shows a density times area analysis of the MnPO. As described in Table 2, there was a statistically significant difference in binding density between treatment groups. Values are mean ± S.E.M. n = 5. * p<0.05.
