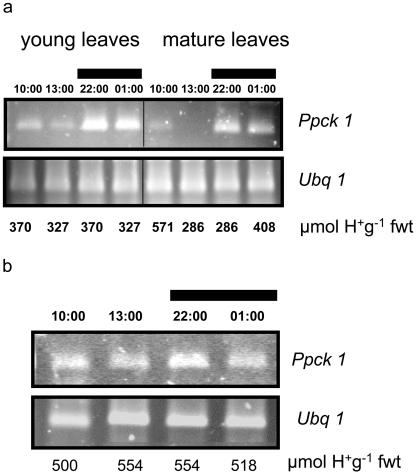
Figure 9.
a, Abundance of transcripts for PEPC kinase (Ppck1) over the day and night in young leaves (C3 photosynthesis) and mature leaves (CAM) of C. minor with corresponding levels of titratable acidity shown for each time point. b, Abundance of Ppck1 transcripts over the day and night in mature leaves of C. minor performing C3 photosynthesis with corresponding levels of titratable acidity shown for each time point. Ubq1 transcripts are shown as control for equal RNA input and RT-PCR conditions. The black bars represent the periods of darkness.

