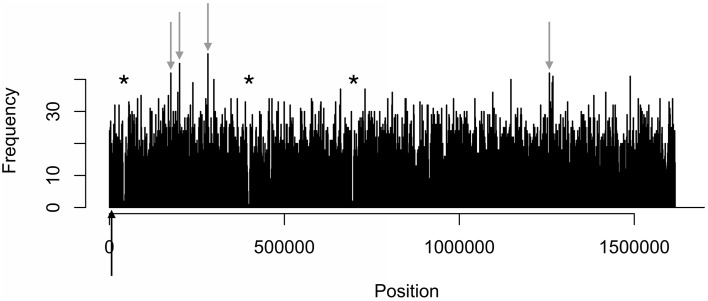
Figure 4.
Distinct areas of hyper- and hypomethylation in the whole-genome methylome plot of 81-176. Distribution plots of all motifs are combined per 1 kb across the genome. Gray arrows indicate hypermethylated areas, which have methylation frequencies of at least 41 and higher. Asterisks indicate major hypomethylated regions, which contain several adjacent bins with methylation frequencies of 4 or less. Black arrows indicate origin of replication (oriC) sites.

