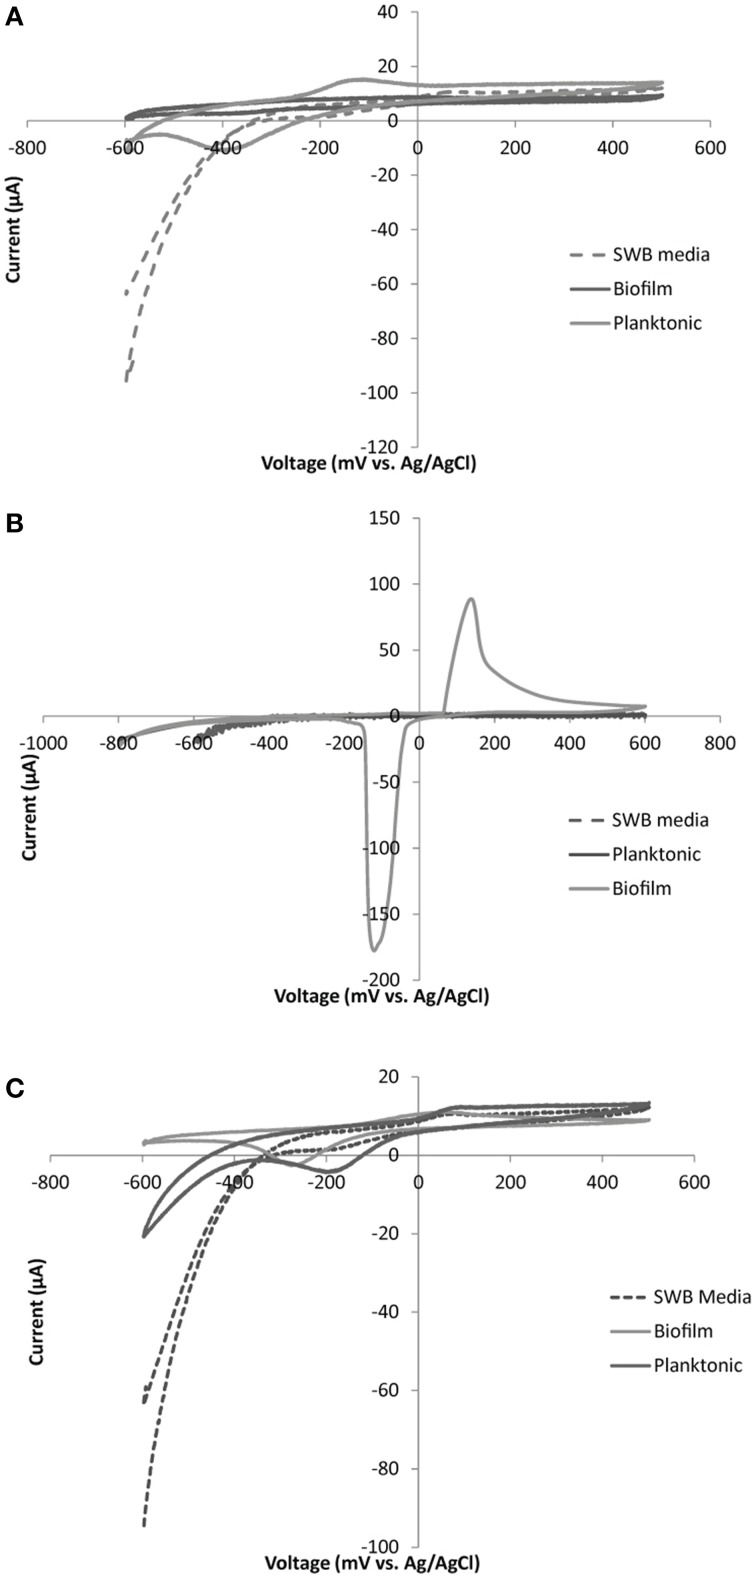
Figure 6.
Representative CV plots for: (A) Marinobacter sp. FeSN3, (B) Idiomarina sp. SN11 and (C) Thallassospira sp. SN3. Plots are displayed for control (SWB media), planktonic cells (suspended biomass removed from electrochemical cell), and biofilm (electrode attached biomass) samples for each organism. Each CV was run with a scan rate of 5 mV/s over a voltage range from −600 to +500 mV with the exception of the biofilm sample from Idiomarina sp. SN11 (B) which was run from −800 to +600 mV.

