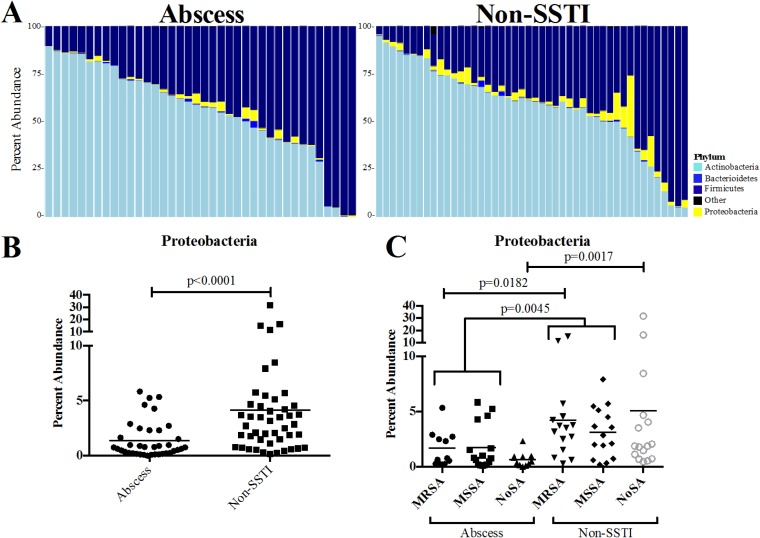
FIG 1.
Characterization of the nasal microbiomes for those that did (abscess) and did not (non-SSTI) develop SSTI. (A) Breakdown of each nasal specimen by phylum. Each column represents one swab. (B) Percent abundance of Proteobacteria in the nose for the abscess and non-SSTI groups. (C) Proteobacteria abundance broken down by nasal culture results (MRSA, MSSA, and NoSA) for the abscess and non-SSTI groups. Horizontal lines represent the average percent abundance. Significant comparisons were calculated using the Mann-Whitney statistical test.

