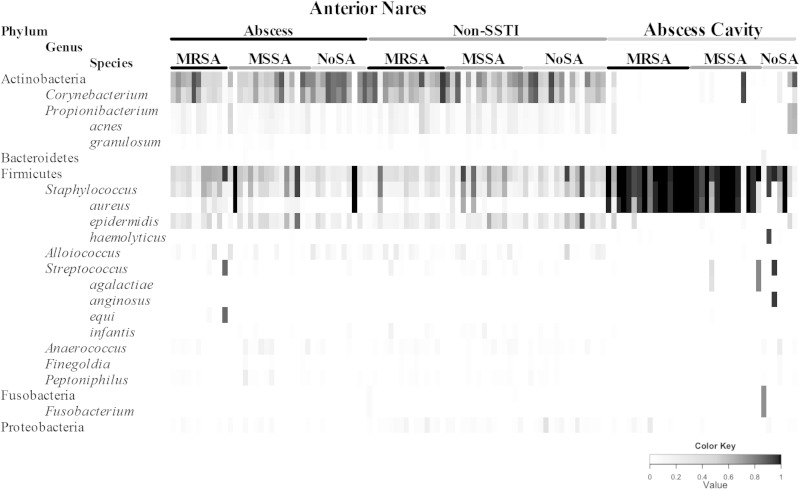
FIG 2.
Heatmap showing the percent abundance for the predominant phyla, genera, and species for all nasal and abscess cavity samples. The anterior-naris specimens are separated according to subjects that did (abscess) and did not (non-SSTI) develop SSTI. Additional subgroupings are based on nasal culture results (MRSA, MSSA, or no S. aureus [NoSA]). The darker the shading, the more abundant the taxon. Each column represents a single sample.

