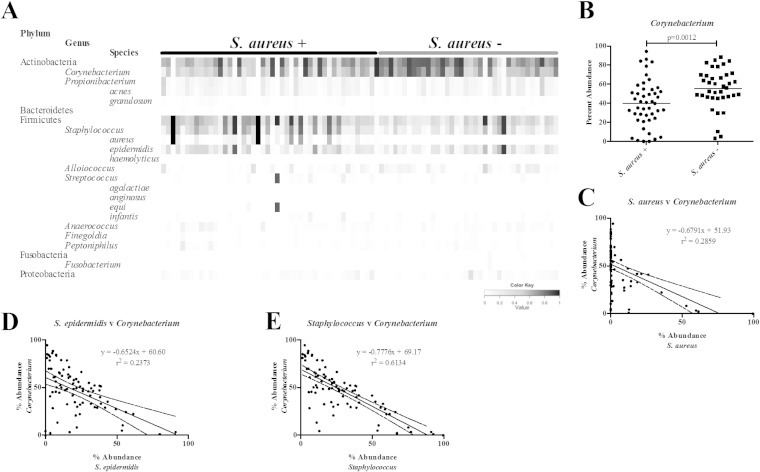
FIG 4.
Impact of Staphylococcus on the nasal microbiome. (A) Heatmap showing the percent abundance for the predominant phyla, genera, and species for nasal samples separated by S. aureus colonization status (based on sequencing results). The darker the shading, the more abundant the taxa. Each column represents a single sample. (B) Percent abundance of Corynebacterium in the nose for individuals that were sequence positive or negative for S. aureus. Horizontal lines represent average percent abundance. Inverse correlation between Corynebacterium and S. aureus (C), S. epidermidis (D), and Staphylococcus (E). Solid lines and inset equations represent the best fit line [y = slope(x) + y intercept]. Dashed lines represent the 95% confidence interval. r2, coefficient of determination.

