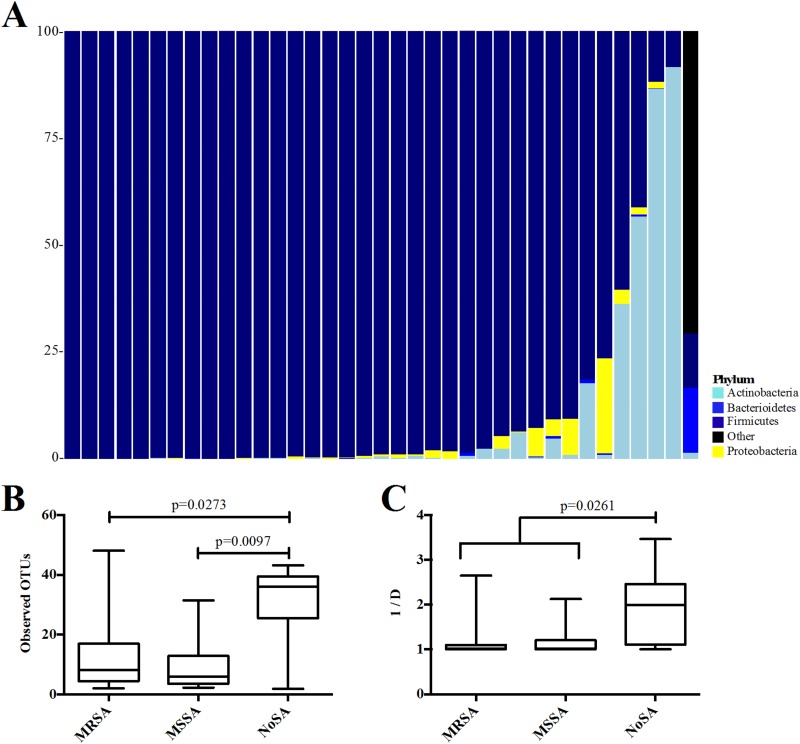
FIG 6.
Characterization of the abscess cavity microbiomes. (A) Breakdown of each abscess cavity specimen by phylum. Each column represents one abscess swab. (B and C) Number of observed OTUs for each abscess (B) and inverse Simpson index (1/D) (C). Each box represents the interquartile range, with the mean shown within. The whiskers spread from the minimum to maximum values. Significant comparisons were calculated using the Mann-Whitney statistical test.

