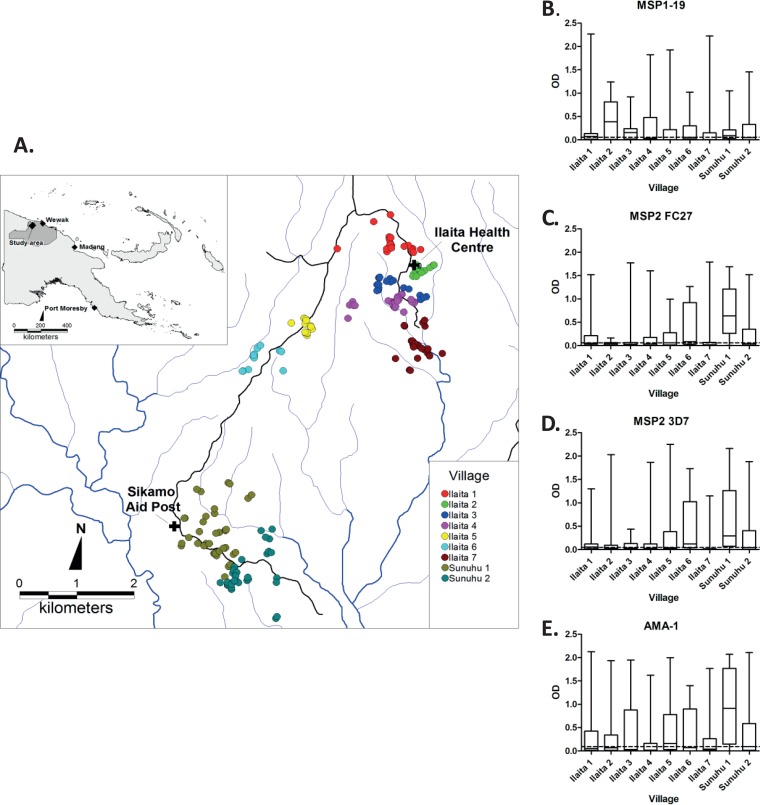
FIG 3.
IgG responses to merozoite antigens by village. (A) Schematic map of study area, including houses of participants (dots) and health centers (crosses) (modified from reference 39 under the Creative Commons Attribution License). (B to E) IgG responses to MSP1-19, MSP2 FC27, MSP2 3D7, and AMA-1 categorized by village. The dashed line in each panel indicates the overall median response for a given antigen. Data are shown as box-and-whisker plots (boxes show medians and interquartile ranges; error bars show minimums and maximums). Antibody levels were significantly different between villages for all antigens (P = <0.001).

