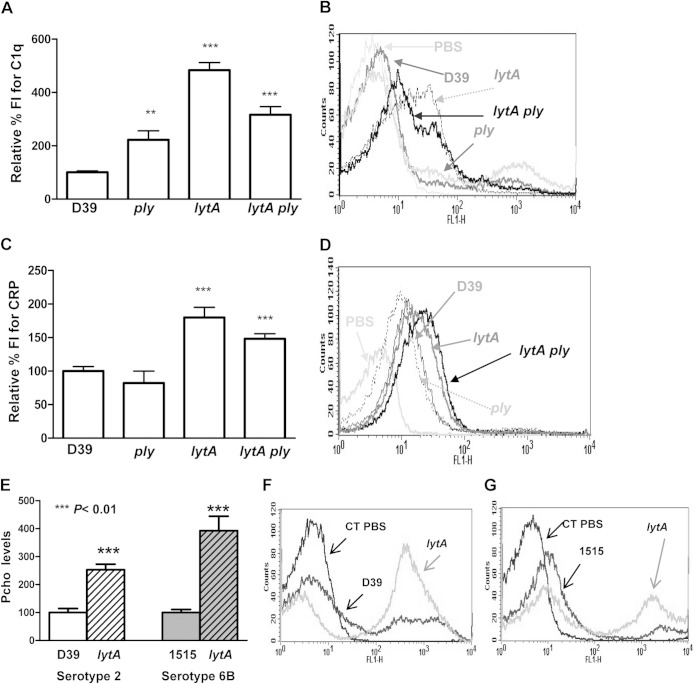
FIG 2.
Ply and LytA divert classical pathway activation. (A) Deposition of C1q on the surface of the different mutants compared to that on the surface of the wild-type strain. (B) Example of a flow cytometry histogram for C1q deposition. (C) Recognition of the wild-type strain and the different mutants by CRP. (D) Example of a flow cytometry histogram for CRP deposition. (E) Pcho levels on the surface of wild-type strains D39 and 1515 of ST2 and ST6B, respectively, and LytA-deficient mutants. (F) Example of a flow cytometry histogram for the Pcho level on the ST2 strain. (G) Example of a flow cytometry histogram for the Pcho level on the ST6B strain. Error bars represent SDs, and asterisks indicate a statistically significant difference compared to the results for the wild-type strain: **, P < 0.01; ***, P < 0.001. For the results for all defective strains compared to the result for the wild type, P was <0.001 (one-way ANOVA with Dunnett's post hoc test). CT, control (bacteria incubated in PBS).

