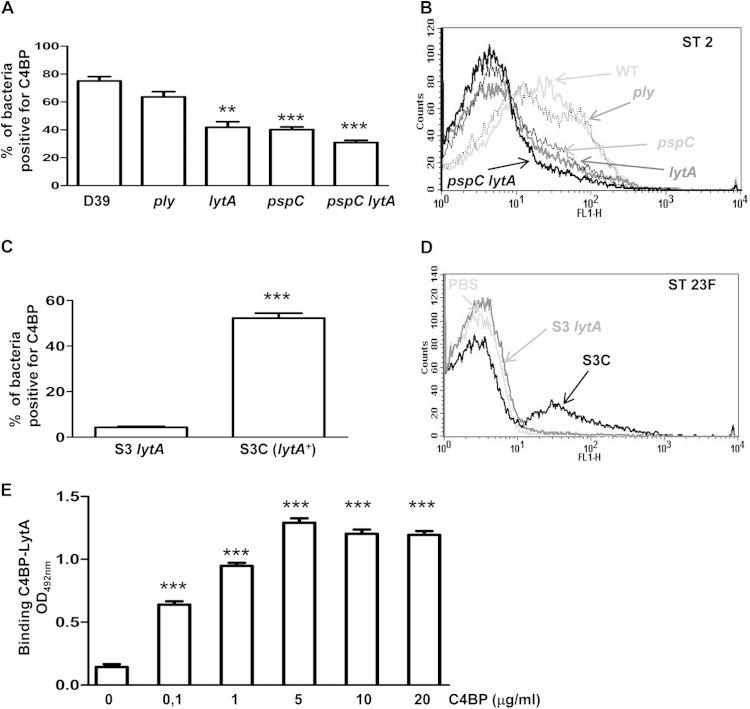
FIG 3.
LytA recruits C4BP to reduce classical pathway activation. (A) Proportion of bacteria positive for C4BP for the D39 wild-type strain and the different mutants. (B) Example of a flow cytometry histogram for C4BP binding for strains with the D39 genetic background. (C) Proportion of bacteria positive for C4BP for the S3 lytA mutant strain and the complemented S3C strain (lytA+) belonging to ST23F. (D) Example of a flow cytometry histogram for C4BP binding for the ST23F strains. (E) Direct binding of 10 μg/ml of LytA to different concentrations of C4BP by ELISA. Error bars represent SDs, and asterisks indicate a statistically significant difference between the results for single mutants and the wild-type strain or between the results for different concentrations of C4BP and those in the absence of protein: **, P < 0.01; ***, P < 0.001. P was <0.05 for the comparison of the C4BP results between the pspC lytA double mutant and the single mutants.

