Figure 2.
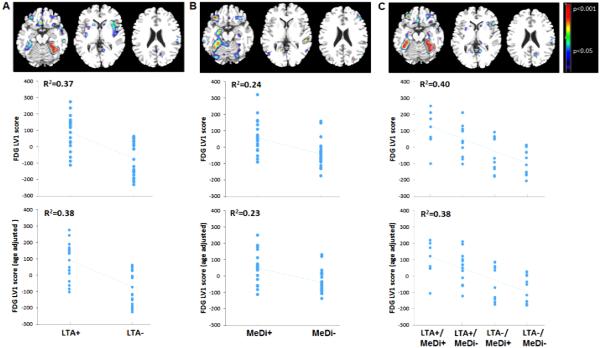
Spatial patterns of CMRglc as a function of physical activity and diet on FDG-PET. Top row: Partial Least Square regression maps (PLS maps; spatial biomarker patterns) that represent the optimal association between FDG-PET images and (A) leisure time physical activity (LTA), (B) Mediterranean Diet (MeDi), and (C) the combination of LTA and MeDi. P values are shown on a color-coded scale to the right. Middle row: LV scores extracted from each significant pattern show reduced FDG uptake, reflecting reduced CMRglc, in NL showing lower vs. higher engagement in leisure time physical activity (LTA− < LTA+); in NL showing lower vs. higher adherence to the MeDi (MeDi− < MeDi+) and as a function of LTA × MeDi (LTA−/MeDi− < LTA−/MeDi+ < LTA+/MeDi− < LTA+/MeDi+). R2 values are reported for each figure (all p’s < 0.001). Bottom row: LV scores are adjusted by age.

