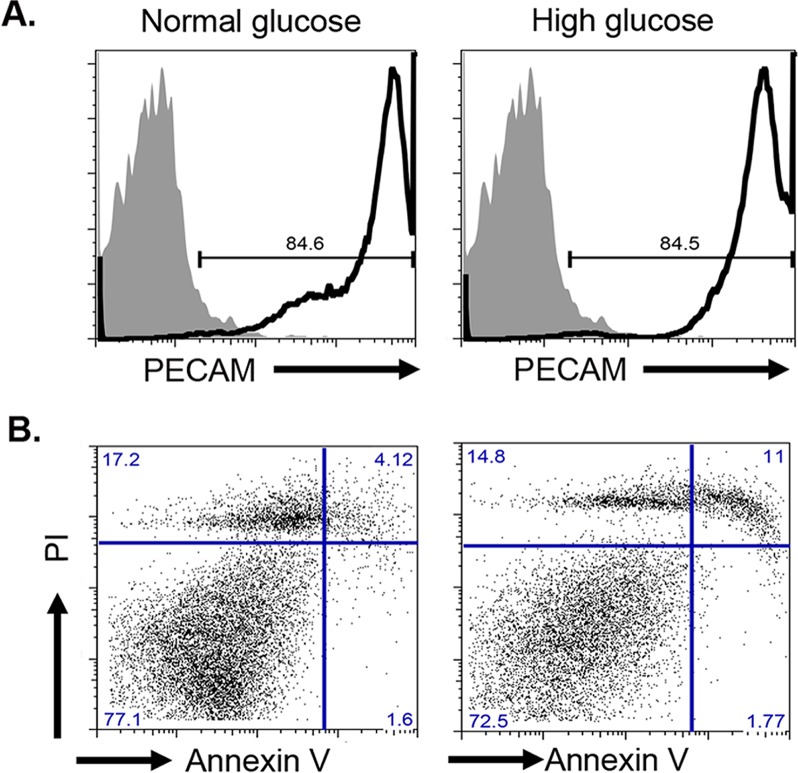
Figure 1.
High glucose-induced REC cell death. (A) Flow cytometry analysis of PECAM-1 in REC. Solid histogram shows levels of mouse IgG1κ isotype control and open histogram shows experimental sample results. (B) Annexin V versus PI labeling to determine apoptosis. Normal and high glucose–cultured cells were labeled with Annexin V-FITC and PI prior analysis. Percentage dead cells: percent Annexin V+PI+, percent live cells Annexin VnegPIneg.

