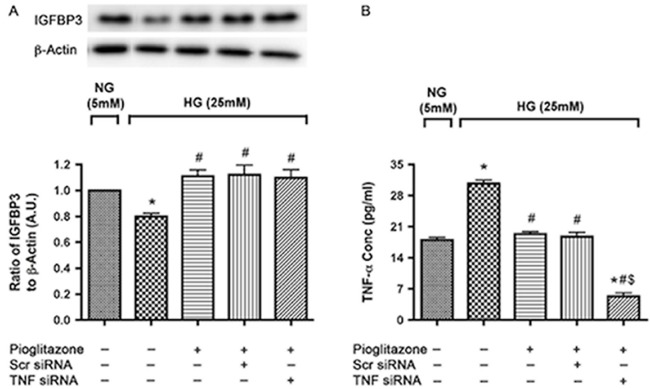
Figure 2.
Pioglitazone induced IGFBP-3 levels in high-glucose medium in a TNFα independent way. (A) Western blot analysis of IGFBP-3 to β-actin ratio in REC transfected with scrambled and TNFα siRNA for 24 hours followed by treatment with 25 μM pioglitazone for 24 hours in 5 and 25 mM glucose. (B) Bar graph of TNFα levels after TNFα transfection. (A) *P < 0.05 versus untreated NG control. #P < 0.05 versus untreated HG control. N = 4. (B) *P < 0.05 versus untreated NG control. #P < 0.05 versus untreated HG control. $P < 0.05 versus respective scrambled siRNA control. Data are mean ± SEM. N = 4.

