
Figure 3.
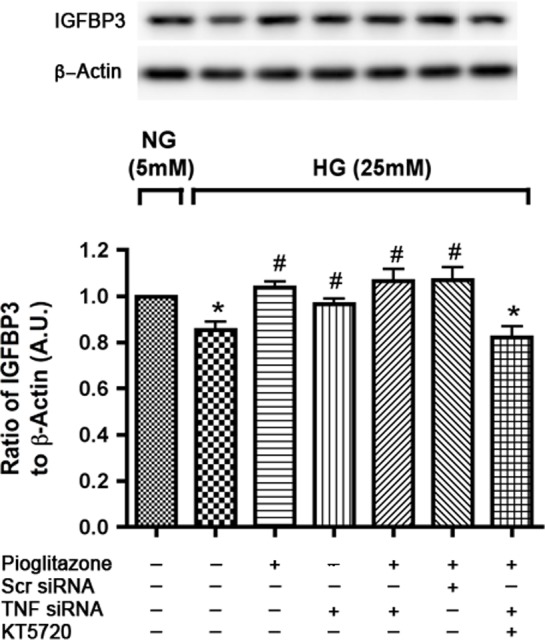
Pioglitazone induced IGFBP-3 expression is through PKA activation in high-ambient glucose. Figure shows bar graph of IGFBP-3 to β-actin levels measured by Western blot in REC cultured in high glucose (25 mM) with TNFα siRNA transfection for 24 hours and then treatment with KT 5720 for 30 minutes followed by 24 hours pioglitazone treatment. Retinal endothelial cells in normal glucose (5 mM) was used as control. *P < 0.05 versus untreated normal glucose control. #P < 0.05 versus untreated high glucose control. Data are mean ± SEM, N = 4.