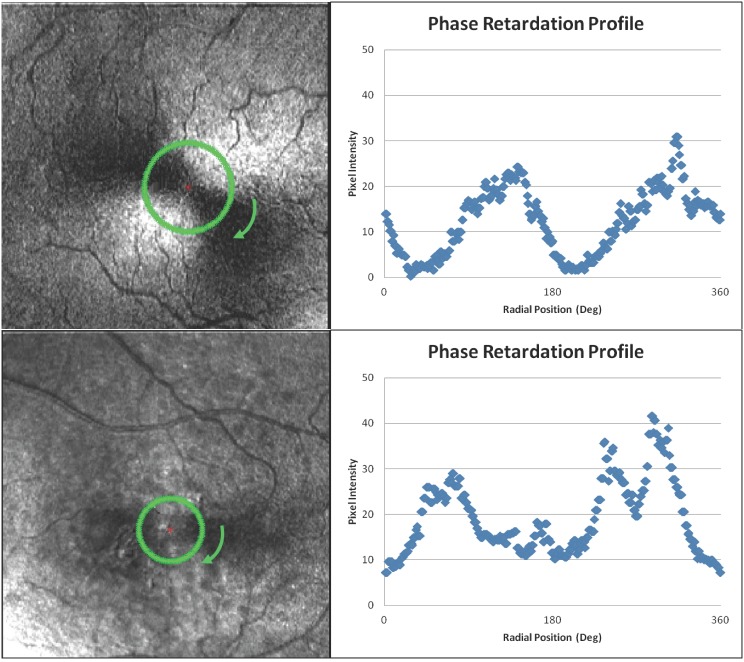
Figure 1.
Top-left: Macular cross pattern from a 77-year-old clinically normal subject with annular region of interest at the eccentricity of the maximum normalized 2f and 4f FFT (1.9°). Top-right: Phase retardation profile at that eccentricity demonstrating a clear 2f function. Bottom-left: Macular cross pattern from a 68-year-old nonexudative AMD subject with annular region of interest at the eccentricity of the maximum normalized 2f and 4f FFT (1.4°). Bottom-right: Phase retardation profile at that eccentricity demonstrating a disrupted 2f function. It is worth noting that the images in the raw datasets have low intensity, making retinal features and the macular cross pattern itself difficult to visualize. The contrast of the images presented in this figure has been stretched for improved visualization. The data presented in the graphs and the data used for analysis were derived from the raw data and not the contrast-enhanced images.

