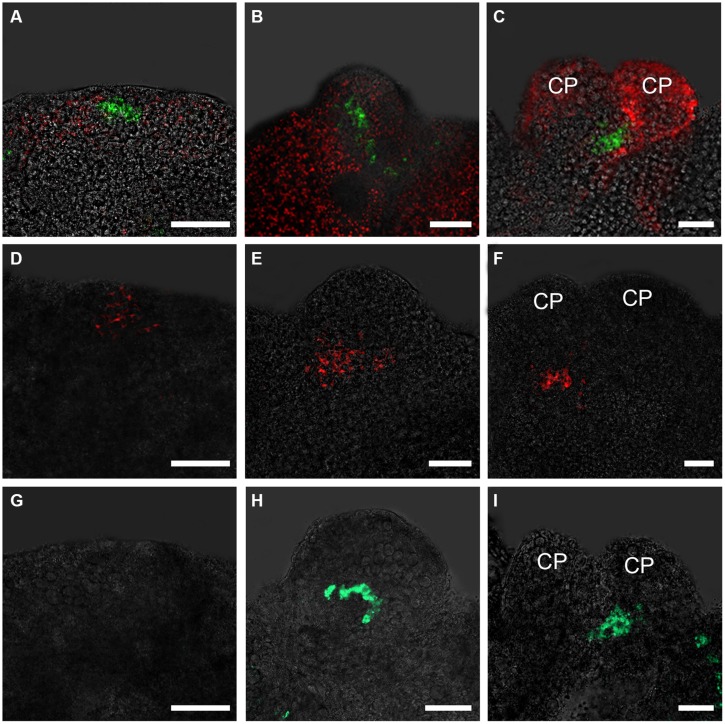
FIGURE 1.
Expression patterns of WOX5, PLT2, and SCR genes in embryonic calli during somatic embryogenesis. (A–C) Expression patterns of WOX5 indicated by pWOX5::GFP in embryonic calli induced in SEIM for 24 h (A; 83.72%, n = 86), 2 days (B; 84.27%, n = 89) and 3 days (C; 80.21%, n = 96). (D–F) Expression patterns of PLT2 indicated by pPLT2::RFP in embryonic calli induced in somatic embryo-inducing medium (SEIM) for 24 h (D; 87.65%, n = 81), 2 days (E; 84.95%, n = 93) and 3 days (F; 90.53%, n = 95). (G–I) Expression patterns of SCR indicated by pSCR::GFP in embryonic calli induced in SEIM for 24 h (G; 87.36%, n = 87), 2 days (H; 89.58%, n = 96) and 3 days (I; 86.90%, n = 84). CP, cotyledon primordia. Red signals in A–C represent chlorophyll autofluorescence. Scale bars = 80 μm.

