FIGURE 3.
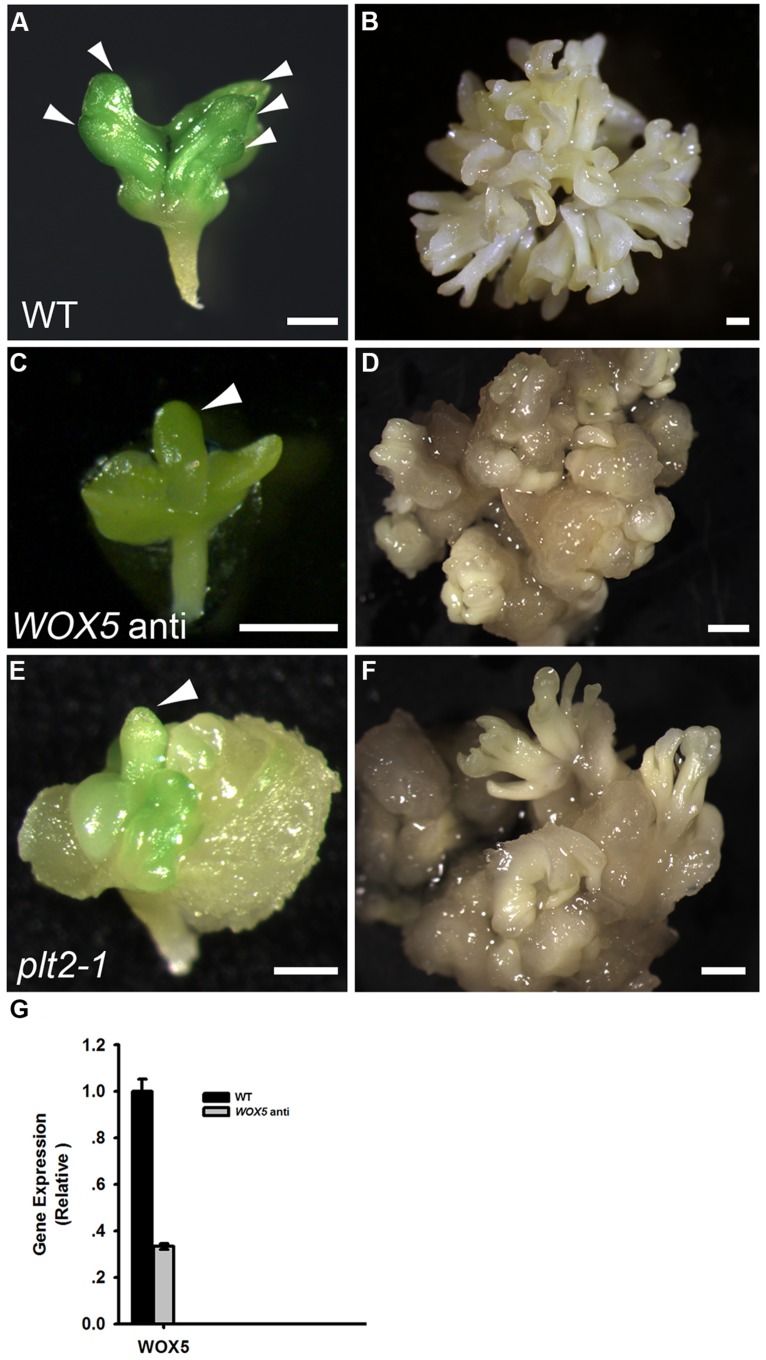
Functional analysis of both WOX5 and PLT2 during somatic embryogenesis. (A,C,E) Phenotypes of primary somatic embryos (PSE) induction from wild type (WT; A), WOX5 antisense (C) and plt2-1 mutant (E) explants. Arrowheads indicate the PSE. (B,D,F) Phenotypes of SSE induction from WT (B), WOX5 antisense (D) and plt2-1 mutant (F) calli grown on SEIM for 8 days. (G) Expression levels of WOX5 in estradiol-induced 15 days shoots of WT and WOX5 antisense plants. Scale bars = 0.5 mm (A,C,E) and 1.2 mm (B,D,F).

