
Figure 1. IP-10 is upregulated when PSCs are cocultured with cancer cells.
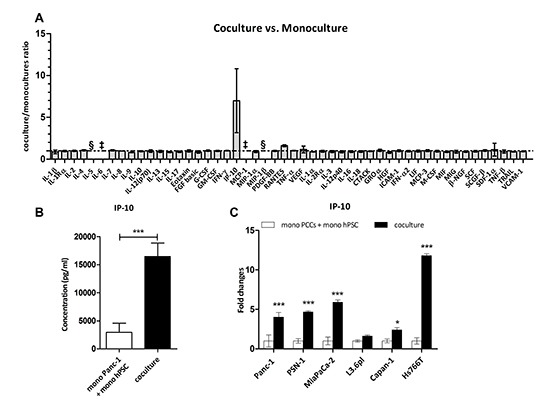
(A) Expression levels of factors in monocultures and cocultures of Panc-1 and hPSC. Data were quantified using the Multiplex suspension array and expressed as a ratio of coculture concentration divided by the sum from the monocultures for each factor (n = 4). §, not detected. ‡, above range of detection. (B) IP-10 concentration (pg/mL) in the culture media of the conditions indicated measured in A. t-test: ***, p < 0.0001. (C) IP-10 levels in supernatants collected after 48 hr. Expression of IP-10 in the coculture was normalized to the sum of monocultures for each of the indicated cell lines (n = 4). Two-way ANOVA followed by Bonferroni's post test: *, p < 0.05; ***, p < 0.0001.