
Figure 2. Induction of IP-10 expression does not require cell contact in coculture.
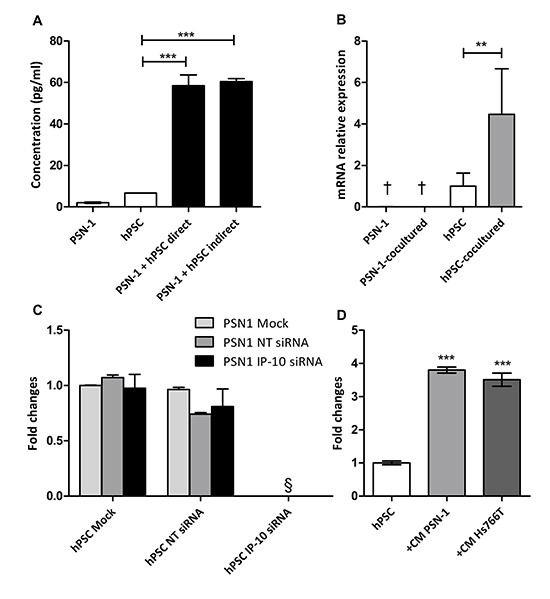
(A) IP-10 concentration in the supernatants from monocultures, direct and indirect cocultures was determined by ELISA. (B) IP-10 mRNA levels in monoculture and after coculture of PSN-1 and hPSC separated by a membrane (6 hr) assayed by qPCR. Values were normalized to GAPDH. (C) PSN-1 and hPSC were transfected with IP-10 siRNA and coculture conditions were set up as indicated 24 hr later. IP-10 expression in the coculture was evaluated with ELISA after 48 hr. NT, non targeting. (D) IP-10 concentration in the supernatant of hPSC with and without conditioned medium from PCCs determined by ELISA. The graph is representative of four independent experiments. Data are shown as mean ± SD. One-way ANOVA followed by Bonferroni's post-test: **, p < 0.001; ***, p < 0.0001. §, not detected. †, below limit of detection.