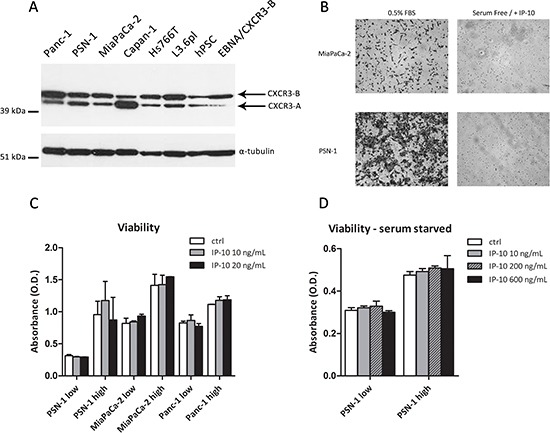
Figure 3. Functional effects of IP-10 on PCCs.

(A) Expression of CXCR3 in PCCs, PSCs and HEK293-EBNA/CXCR3-B analyzed by Western Blot. α-tubulin was used as loading control. (B) Microphotographs of PCCs migrated through the Boyden chamber in response to 0.5% FBS or IP-10 (24 hr). (C-D) Viability of PCCs after IP-10 addition determined using the MTT assay. Low/high refers to cell seeding density. Data are representative of two/three independent experiments. Data in the histograms are presented as mean ± SD.
