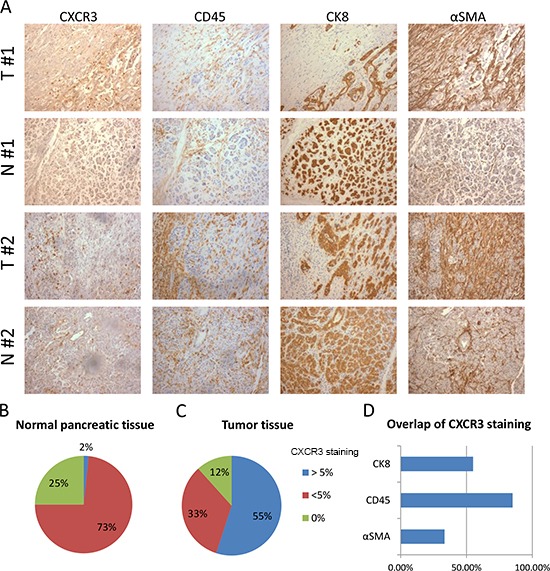
Figure 4. Expression of CXCR3 is elevated in PDAC compared to normal pancreas and is associated with leukocytes infiltration.

(A) The panel shows representative staining for CXCR3, α-SMA, CD45 and CK8 for two patients (patient #1, patient #2). For each patient one area of the tumor (T) tissue is compared with one of the normal (N) tissue surrounding the tumor. (B-C) Pie charts represent the percentages of normal pancreatic tissue (B) and tumor tissue (C) that have none, more or less than 5% area stained positive for CXCR3. (D) The graph represents the percentage of tumors where colocalization is seen between CXCR3 and CD45, CK8 or α-SMA. Only tumors where CXCR3 is expressed in more than 5% of total area were analyzed.
