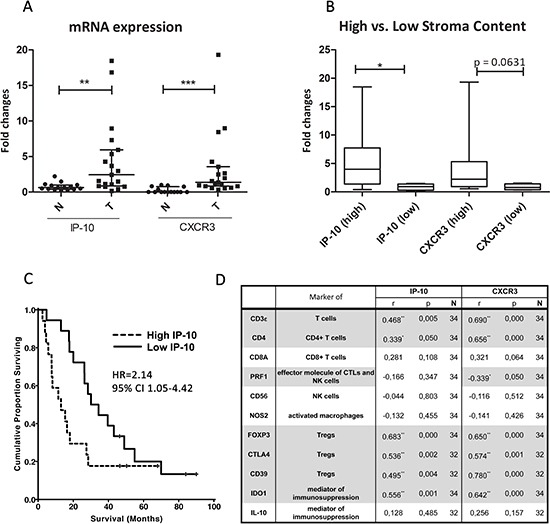
Figure 5. IP-10 and CXCR3 mRNA expression and correlation with leukocyte markers in PDAC.

(A) mRNA levels of IP-10 and CXCR3 in PDAC tumors (T; n = 19) compared to the adjacent normal pancreatic tissue (N; n = 15). Line indicates the median with the interquartile range. (B) Amount (high/low) of stroma content in PDAC directly associates with the expression of IP-10 and CXCR3. IP-10 and CXCR3 levels were measured by qPCR, normalized to endogenous GAPDH control and fold changes calculated over the expression levels in pancreatic samples from normal control tissue. Mann Whitney test *, p < 0.05; **, p < 0.001; ***, p < 0.0001. (C) Kaplan-Meier analyses of patients with resected PDAC stratified by high and low expression levels of IP-10 (n = 48). HR, Hazard ratio; CI, confidence interval. (D) Spearman's rho correlation between mRNA levels of the indicated genes, and IP-10 and CXCR3 levels in PDAC and normal pancreatic tissue. r, strength of the correlation; p, p-value; N, number of samples. Grey highlight indicates statistically significant correlation: *, p < 0.05; **, p < 0.001; ***, p < 0.0001; ns, not significant.
