
Figure 2. Lipid A induced apoptosis in tumor cells in vivo, increased by oxaliplatin.
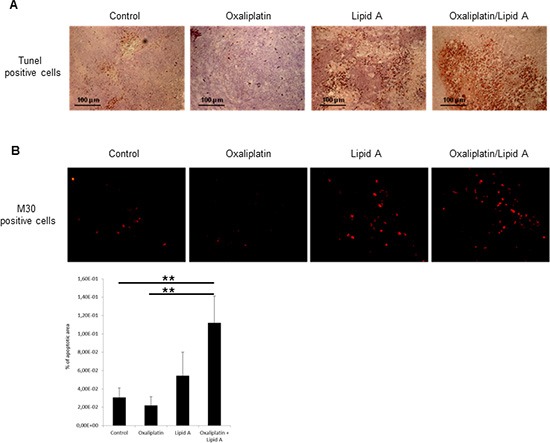
Tumor-bearing rats were treated at day 21 with oxaliplatin or saline solution (control). At day 28, rats were treated with lipid A or saline solutions. Tumors were harvested at day 29. (A) Apoptosis in tumors was detected by TUNEL staining (brown staining, upper panel). (B) Apoptosis in tumor cells was detected by M30 immunostaining (red staining, lower panel). Images are representative of 3 independent experiments with 3 animals per group. Percentage of apoptotic area on slides was represented in the lower graph. Significant differences were determined by an Anova followed by a Bonferroni test.,**p < 0.01.