
Figure 5. Oxaliplatin induced chemokine production which associated with lipid A, induced the iNOS-expressing-neutrophil recruitment.
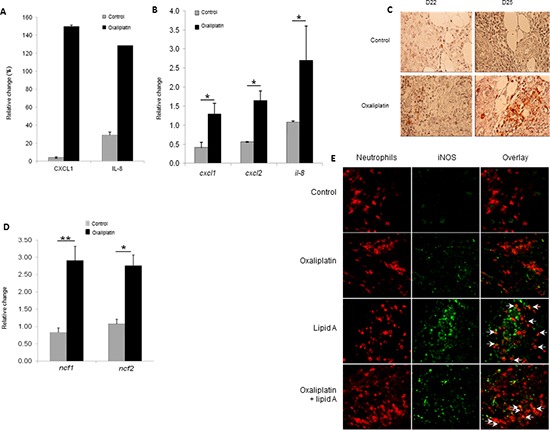
(A) Eight days after injection of oxaliplatin or saline solution (control), blood was collected and plasma level of chemokines was analysed by cytokine array. The relative abundance of CXCL1 and IL-8 was expressed as a percentage of an internal control. (B) Tumor-bearing rats were treated by oxaliplatin or saline solution (control) at day 21. Ninety six hours later, tumors were harvested and expression levels of cxcl1, cxcl2 and Il-8 mRNAs were determined by RT-PCR and normalized to gapdh gene expression. (C) The recruitment of neutrophils in tumors from control or oxaliplatin-treated rats was determined by immunostaining (anti-HIS48 Ab, red) of tumors harvested at day 22 and 25. (D) As in (B), tumors were harvested and RNA was extracted. Expression levels of ncf1 and ncf2 were determined by RT-PCR and normalized to gapdh gene expression. Bars are means ± SEM. Significant differences were determined by Mann-Whitney U test. *p < 0.05, **p < 0.01. (E) Tumors from control, oxaliplatin, lipid A or oxaliplatin + lipid A rats were removed at day 29, fixed, cut into 5-mm cryosections and stained for neutrophil (anti-HIS48 Ab, red) and iNOS (anti-iNOS Ab, green). Merged signals (yellow) are pointed with white arrows in the overlay pictures. (C and E) are representatives of 3 independent experiments with 3 animals per group (scale bars = 50 μm).