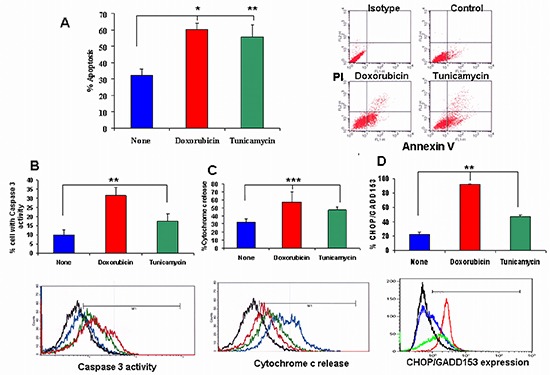
Figure 3. The effect of doxorubicin and tunicamycin on apoptosis.

(A) Determination of the effect of doxorubicin and tunicamycin on apoptosis by FACS analysis. Doxorubicin (0.1 μg/ml) significantly induced apoptosis in 4T1 cells (**p < 0.001). Tunicamycin induced apoptosis significantly at 10 μg/ml (*p < 0.05). On the upper right, representative FACS analysis of apoptosis by AnnexinV/PI of cells incubated with doxorubicin and tunicamycin compared to non-treated cells. (B) Caspase 3 activity was significantly increased by these drugs (**p < 0.001). (C) Cytochrome c release was increased significantly by these drugs (***p < 0.006). (D) CHOP/GADD153 expression was significantly increased by doxorubicin and tunicamycin (**p < 0.001). Representative FACS analysis of caspase 3 activity, cytochrome c detection and CHOP/GADD153 expression in 4T1 cells treated with doxorubicin and tunicamycin compared to non-treated cells. Black line: Isotype. Blue line: Non treated control cells. Red line: Doxorubicin treated cells. Green line: Tunicamycin treated cells.
