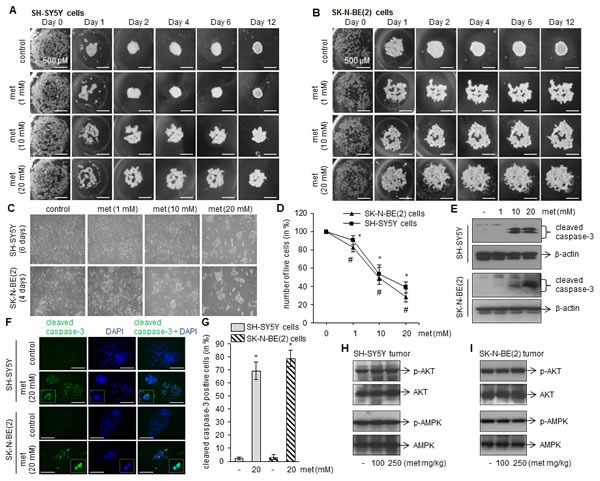
FIGURE 3. Metformin inhibits the neuroblastoma spheroid formation and induces apoptotic cell death in vitro.

(A and B) Representative images showing progression of spheroid formation in presence or absence of metformin in in vitro hanging drop assay. Scale= 500 μm. Experiments were performed four times independently. (C) Phase contrast images showing cell morphology after metformin treatments (1, 10 and 20 mM). After 4 days (for SK-N-BE(2)) and 6 days (for SH-SY5Y) of metformin treatments cells were photographed (C), live cells were counted by trypan blue and plotted (D). The values represent mean ± SD from eight independent experiments. For SH-SY5Y, *p < 0.05 vs control; for SK-N-BE(2), #p < 0.05 vs control. Western blots (E) and immunofluorescence (F) for cleaved caspase-3 was performed after 4 days (SK-N-BE(2) cells) and 6 days (SH-SY5Y) metformin exposure. DAPI was used to stain nuclei (blue). Scale= 100 μm. Cleaved caspase-3 positive cells (green) were counted in ten random fields by imageJ and plotted (G). The experiments were performed three times independently. *p < 0.05 vs control. Representative Westen blots showing levels of phosphorylated and total form of AMPK and AKT in SH-SY5Y tumor (H) and SK-N-BE(2) tumor (I). The blots are representative of ten tumor samples from control and experimental mice.
