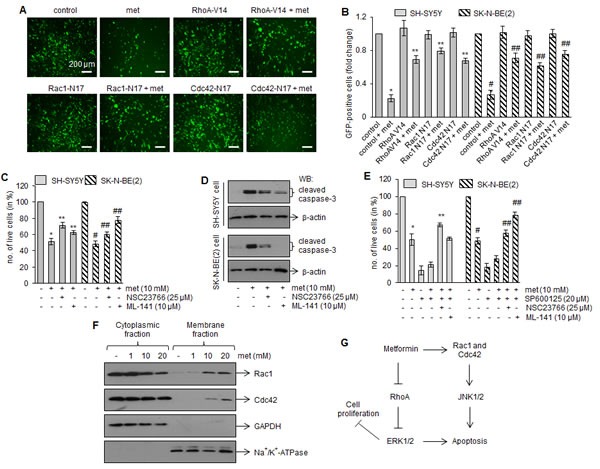
FIGURE 6. Rho GTPase inhibitors attenuate metformin effects on the survival of neuroblastoma cells.

(A) Fluorescence images showing the signals of GFP-Rac1, GFP-Cdc42 and GFP-RhoA in SH-SY5Y cells. Cells were infected with adenoviruses expressing GFP-fused dominant–negative Rac1-N17 and Cdc42-N17, and constitutively active RhoA-V14. GFP alone were used as control. After 24 h infection, cells were treated with metformin (10 mM) and further grown for 6 days and photographed. Scale= 200 μm. Number of GFP-containing cells (green) was counted from 10 random fields and plotted (B). Similar adenovirus experiments were performed with SK-N-BE(2) cells, and number of GFP-positive cells was counted after 4 days of metformin (10 mM) treatment and plotted (B). Results are mean ± SD from four independent experiments. *p < 0.05 vs control, **p < 0.05 vs metformin 10 mM, #p < 0.05 vs control, ##p < 0.05 vs metformin 10 mM. (C) Bar diagram showing number of live cells after treatments with metformin (10 mM) alone or in combination with Rac1 inhibitor (NSC23766; 25 μM) or Cdc42 inhibitor (ML141; 10 μM). After 4 days (SK-N-BE(2)) or 6 days (SH-SY5Y) treatments, number of live cells were counted by trypan blue. The experiments were performed four times and values represent mean ± SD. *p < 0.05 vs control, **p < 0.05 vs metformin 10 mM, #p < 0.05 vs control, ##p < 0.05 vs metformin 10 mM. Total cell proteins were extracted from these treatment groups and Western blotting for cleaved caspase-3 was performed (D). Blots are representative of four independent experiments. (E) Bar diagram showing number of live cells after treatments with JNK inhibitor (SP600125; 20 μM) alone or in combination with Rac1 inhibitor (NSC23766; 25 μM), Cdc42 inhibitor (ML141; 10 μM) and metformin (10 mM) for 4 days (SK-N-BE(2) or 6 days (SH-SY5Y cells). Each bar represents mean ± SD of six independent experiments. *p < 0.05 vs control, **p < 0.05 vs metformin 10 mM, #p < 0.05 vs control, ##p < 0.05 vs metformin 10 mM. (F) Western blots showing Rac1 and Cdc42 levels in cytoplasmic and membrane fractions prepared from SH-SY5Y cells after 6 days metformin treatments. Antibodies against glyceraldehyde 3-phosphate dehydrogenase (GAPDH) and Na+/K+-ATPase were used as cytoplasmic and plasma membrane protein markers, respectively. Results are representative of three independent experiments. (G) Putative model for metformin signaling in neuroblastoma cells. Metformin activates Rac1 and Cdc42, and inhibits RhoA in neuroblastoma cells. The activated Rac1 and Cdc42, in turn, promote phosphorylation of JNK, while inhibition of RhoA reduces ERK phosphorylation. These effects initiate apoptotic cell death in neuroblastoma cells and inhibit tumor growth in xenograft mice model of neuroblastoma.
