
Fig. 1. Metformin decreases U87 cell viability via CLIC1 inhibition.
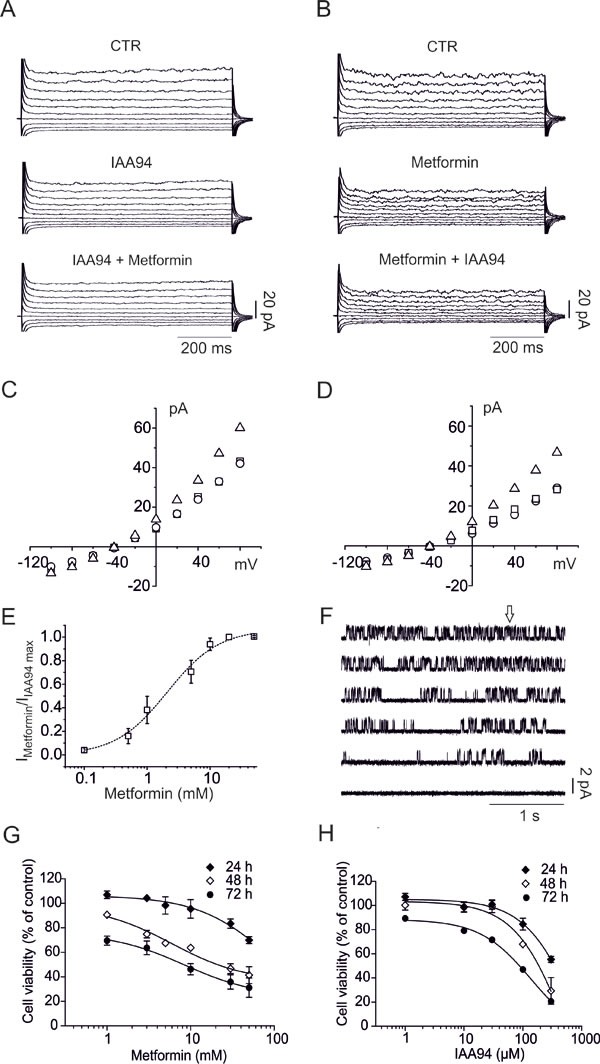
A) Representative family of membrane currents elicited by 800 ms voltage steps from −100 to +80 mV, starting from a holding potential of −40 mV, is shown in the control condition (top), after perfusion of IAA94 (100μM, middle) and after addition of metformin (10mM, bottom) and vice versa (B). C) Current/voltage relationships from the data in A, in which IAA94 is perfused alone or followed by metformin, and vice versa (D). Total current (triangles) is plotted together with the current amplitude after IAA94 (circles) perfusion or IAA94 and metformin (squares). E) The ratio between metformin and IAA94 sensitive currents (+80 mV, 750 ms test potential) was used to calculate a metformin EC50 of 2.1 ± 0.4 mM (mean ± s.e.m.) from a dose/response plot. (n=4 independent experiments for each concentration). F) Ten mM metformin (arrow) caused inhibition of CLIC1 single-channel opening in outside-out experiments, recorded at +60 mV holding potential (single channel in control conditions Popen= 0.36±0.012, 0.28±0.08 and 0.09±0.07 between 5 and 10 and 10 and 15 seconds after metformin addition, respectively; n=3 total of 4 minutes continuous recording). G-H) Time- and dose-dependent effects of metformin and IAA94 on U87 cell survival evaluated by MTT assay. Experiments were run in quadruplicate and the percentage of inhibition calculated against vehicle control. Data are expressed as mean ± s.e.m of n=3 independent experiments. Statistical significance is reported in Table 1.