
Fig. 5. Metformin causes GBM CSC arrest in the G1 phase of the cell cycle.
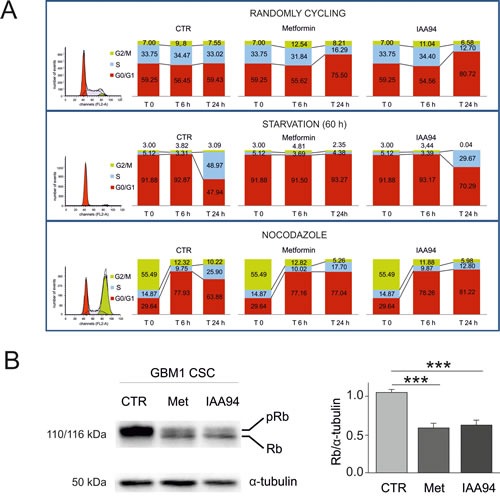
A) GBM1-derived CSCs were evaluated by FACS analysis for cell cycle progression after propidium iodide staining (n=2). Control, metformin (10 mM)- or IAA94 (100 μM)-treated cells were analysed after 6 and 24 hours without synchronisation (randomly cycling, upper panels), after G0/G1 arrest (induced by 60 hours of growth factor deprivation, middle panels) or after blockade induced by nocodazole/cytochalasin B treatment (overnight incubation with 50 ng/mL nocodazole + 25 ng/mL cytochalasin B, lower panels). At experimental time 0 (depicted in the original histograms from the FACS on the left, and in the first superimposed bars), randomly cycling cells show the following cell cycle distribution: G0/G1= 59.25%; S=33.75%; G2/M=7%; starvation induced a clear G0/G1 synchronisation (91.88% of the cells, with only 5.12 and 3% in phase S and G2/M, respectively); nocodazole treatment caused cell accumulation in G2/M (55.49%) with 29.64% of the cells in G0/G1 and 14.87% in S phase. Cells were subsequently shifted into standard growth factor-containing CSC medium and allowed to grow for 6 or 24 hours. Treatment with both metformin and IAA94 caused a strong reduction of cell cycle progression that was mainly due to the blockade of G1-S transition. B) Western blot analysis of retinoblastoma (Rb) protein in metformin- and IAA94-treated CSCs. Metformin (10 mM) and IAA94 (100 μM) affects Rb protein expression and phosphorylation status in GBM1 CSCs. Treatment with either drug not only drastically reduced Rb protein content, but also led to a higher prevalence of non-phosphorylated protein in treated cell extracts compared to control conditions. Thus, metformin- and IAA94-induced cell cycle arrest correlates with a reduction of Rb content and a shift towards the non-phosphorylated form. Representative Western blot is reported in the left panel, and the quantification by densitometric analysis of two replica experiments is depicted in the right panel (***p<0.001, t-test).