
Fig. 6. CLIC1 current inhibition by metformin is use-dependent.
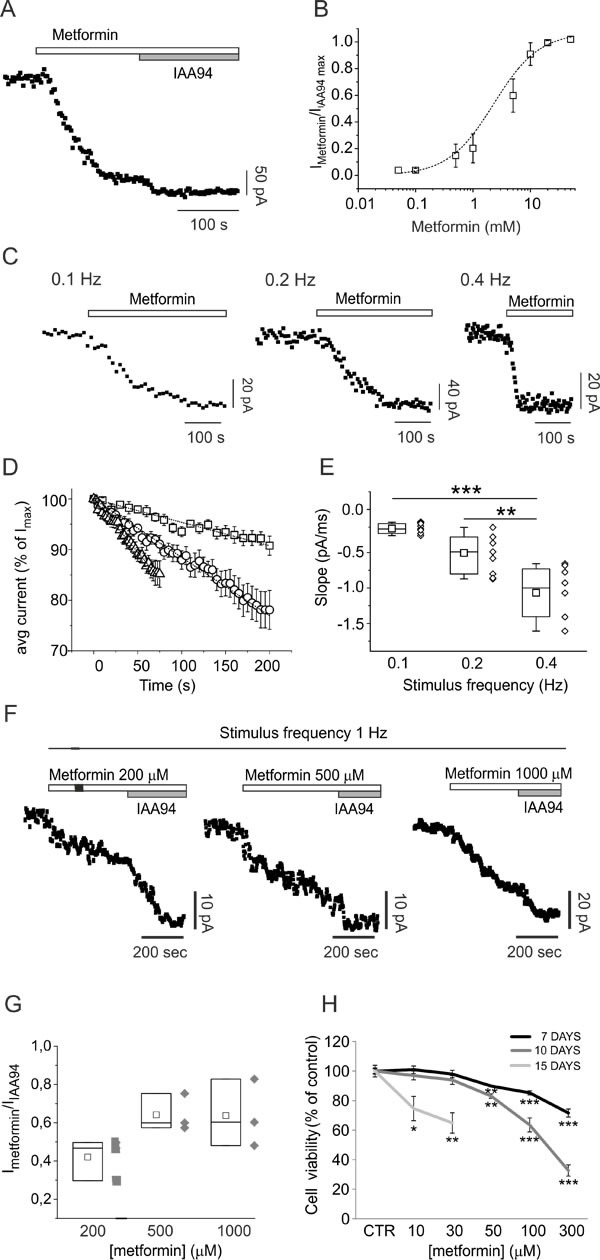
A) Time-course of whole-cell currents in CHO cells transfected with human wt CLIC1, and stimulated every 5 seconds with 800 ms, 100 mV test potential from −40 mV holding voltage. Each point represents the average current of the last 100 ms of a single current trace. Once the current amplitude reached a constant value, the cell was challenged with 10mM metformin. At a new steady-state the cell was perfused with 100μM IAA94 that was used to completely block CLIC1 conductance. B) Dose-response curve built perfusing cells with different metformin concentrations (0.05-50 mM) followed by IAA94 (100μM). Each point is the average result of 5 measurements. C) Examples of metformin (10mM) inhibition kinetics in three different experiments in which cells were stimulated with voltage steps delivered every 10, 5 or 2.5 seconds. D-E) Negative slope portions of several experiments, as in panel C, at different stimulation frequencies were normalised as percentages of the maximum current value of each trial. Average inhibition time-courses at stimulation frequencies 0.1 (squares; n=7), 0.2 (circles; n=9), and 0.4 Hz (triangles; n=8) were plotted and fitted with a linear regression function (D). Calculated slopes of the average inhibition of time-course currents (0.1 Hz= −0.231±0.01; 0.2 Hz= −0.577±0.01; 0.4 Hz= −1.052±0.02) are coincident with the average result obtained by plotting single-experiment metformin inhibitory slopes in a box-plot (E). Higher frequency stimulation induces faster inhibition of the current. The difference between 0.1 and 0.2 Hz is not statistically significant (p=0.12), but stimuli at 0.4 Hz are significantly different from slower stimulation frequencies (**p <0.001, ***p <0.0001, one-way ANOVA, followed by Tukey test). F) Representative metformin-sensitive membrane current time-course of perforate whole-cell patch clamp experiment in GBM CSCs, at high frequency stimulation. Voltage step (100 mV, 400 ms) from −40 to +60 mV of membrane potential was delivered every second (1 Hz). Once the membrane current amplitude was stabilized, metformin was perfused during continuous stimulation. In all cases membrane current decreases but was not further inhibited by IAA94 (100μM). G) Ratio between metformin and IAA94-sensitive current in the different conditions reported (n=3). H) CSC viability measured by MTT assay after 7 (black line), 10 (dark grey) or 15 (light grey) days of metformin treatment (n=2; *p<0.05, **p< 0.01 and ***p<0.0001, t-test vs. vehicle-treated cultures).