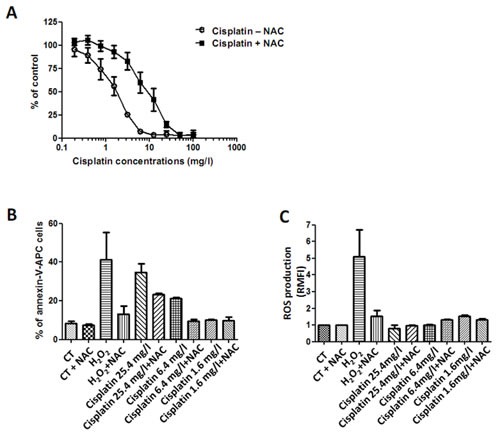
Figure 2. Effect of cisplatin on MPM cell lines.

Three cell lines of MPM were treated with increasing doses of cisplatin alone or combined to NAC (5mM) for 72h. Cell viability was determined using Uptiblue reagent. Values represent the mean ± SEM of three independent measurements. B and C, MPM cell lines were treated with three doses of cisplatin alone or combined to NAC (5mM) for 24h. Cell death (B) was measured by flow cytometry, after Annexin-V-APC cell staining. Cell death induction is expressed in percentage of annexin-V-APC labeled cells. ROS detection (C) was performed with flow cytometry thanks to a specific molecular probe CM-H2DCFA. Fluorescence values are expressed in RMFI. Values represent the mean ± SEM of three independent measurements on three distinct cell lines.
