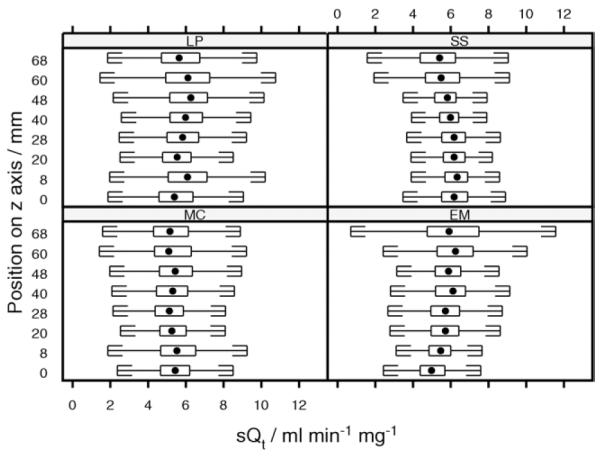
Figure 3.

Distribution of normalized perfusion (sQt) along the z axis for human scans. Box and whisker plots show the distribution of values of sQt measured within each z axial plane. Central dot, median value, extremes of box indicate upper and lower quartiles. Whiskers are drawn at a standard span from each quartile. The slice at 20 mm was positioned on the pulmonary artery bifurcation, with other slices reading caudally.
