
Fig. 8.
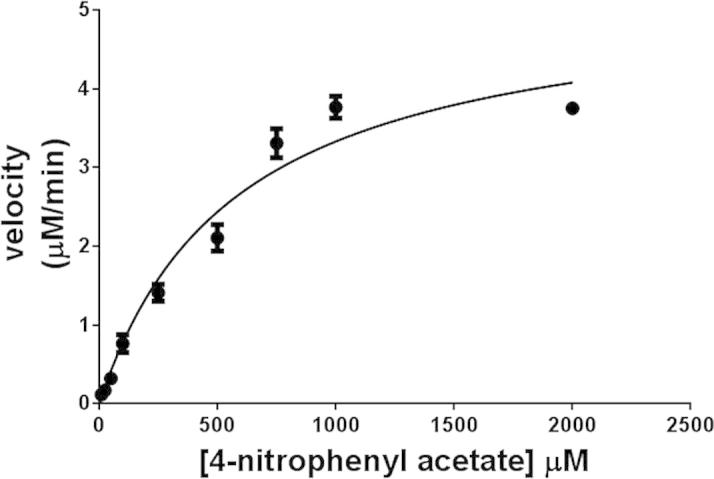
A representative Michaelis–Menten plot of WT CES1. Enzyme kinetics of pNPA hydrolysis catalyzed by WT CES1. The initial velocity was obtained by subtracting the blank hydrolysis from the enzymatic hydrolysis at each substrate concentration.
Official websites use .gov
A
.gov website belongs to an official
government organization in the United States.
Secure .gov websites use HTTPS
A lock (
) or https:// means you've safely
connected to the .gov website. Share sensitive
information only on official, secure websites.
A representative Michaelis–Menten plot of WT CES1. Enzyme kinetics of pNPA hydrolysis catalyzed by WT CES1. The initial velocity was obtained by subtracting the blank hydrolysis from the enzymatic hydrolysis at each substrate concentration.