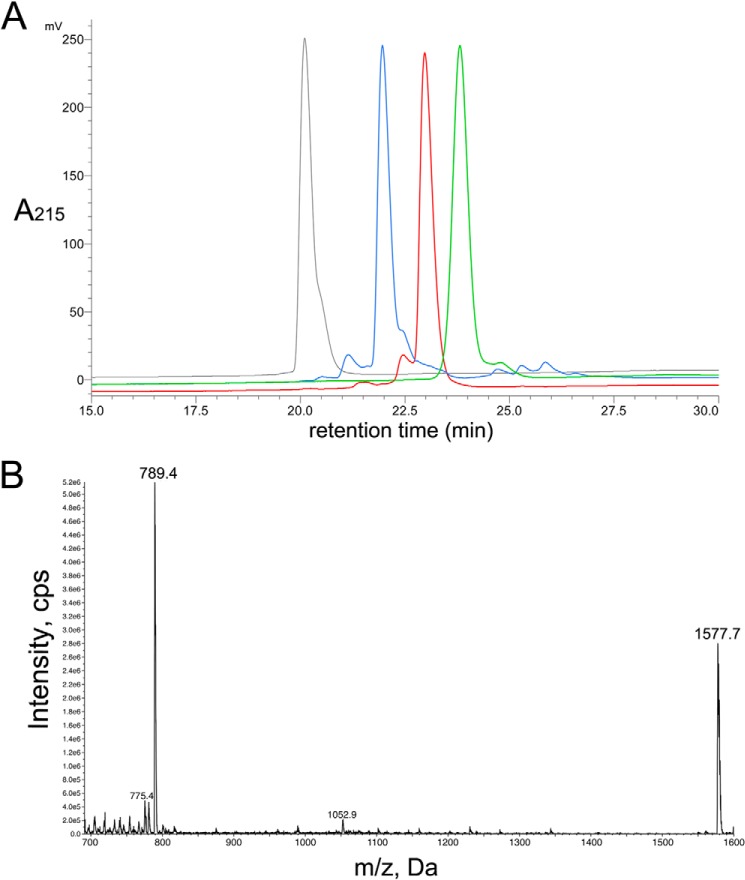
FIGURE 1.
HPLC and ESI-MS profile of [N11A,N12A]RegIIA. A, an overlay of the analytical RP-HPLC traces for RegIIA (black), reduced and Acm-protected [N11A,N12A]RegIIA (red), oxidized and Acm-protected [N11A,N12A]RegIIA (blue), and [N11A,N12A]RegIIA (green). Peptides were analyzed with a Phenomenex C18 Jupiter 300 column (150 × 2 mm) using a solvent gradient from 5 to 50% buffer B for 35 min. B, ESI-MS data of [N11A,N12A]RegIIA.

