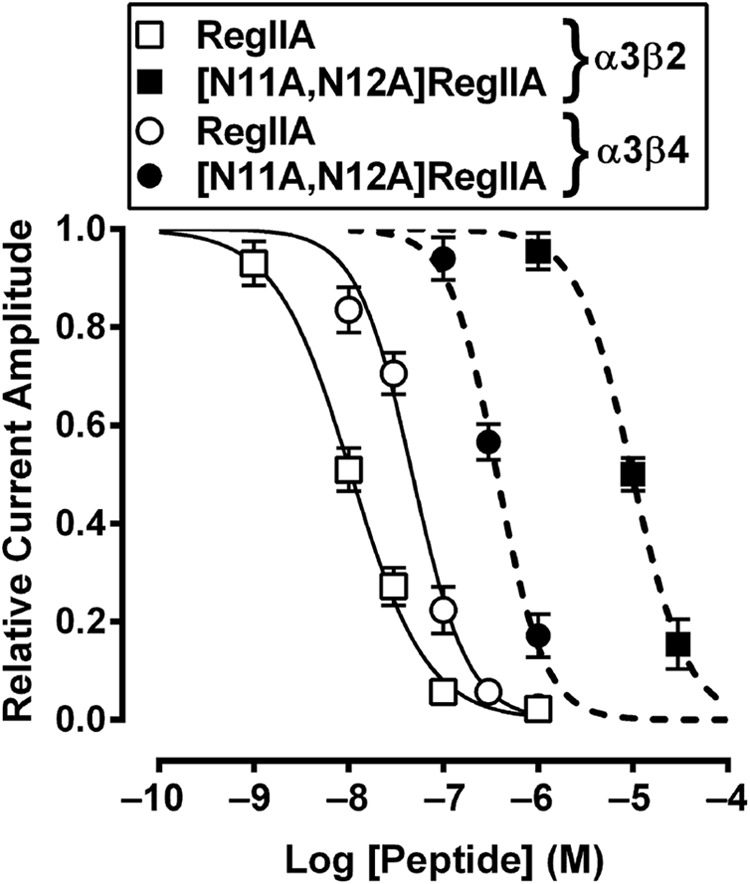
FIGURE 4.

[N11A,N12A]RegIIA inhibition of α3β2 and α3β4 nAChR compared with wild-type RegIIA inhibition of these receptors. Concentration-response curve for [N11A,N12A]RegIIA gave IC50 values of 370 nm and 9.9 μm at α3β4 (▴) and α3β2 (■) receptors, respectively, with an approximate 27-fold increased selectivity for α3β4 nAChR compared with RegIIA. Data represent mean ± S.E., n = 4–6.
